Project Overview

StudentFinance partners with schools to offer income share agreements (ISAs). With an ISA, a student doesn’t pay tuition up front. Instead, once they graduate and start working, they pay back a small percentage of their salary for a set period of time.

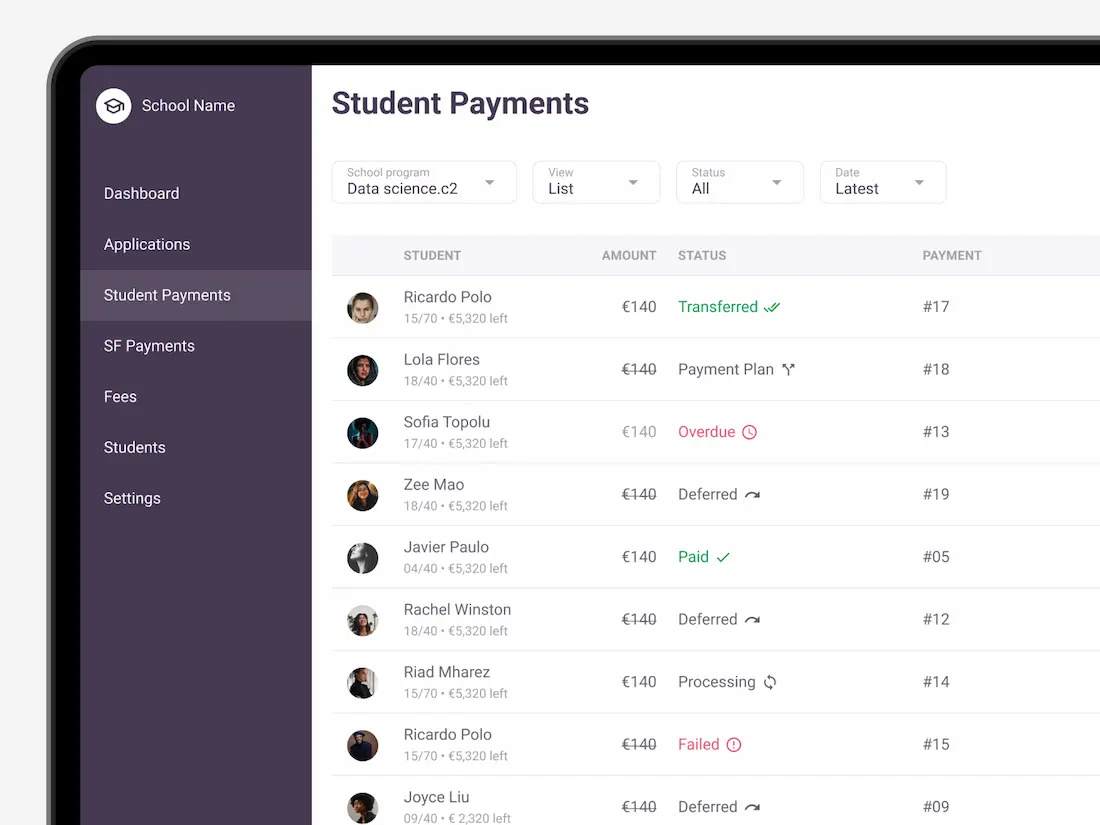
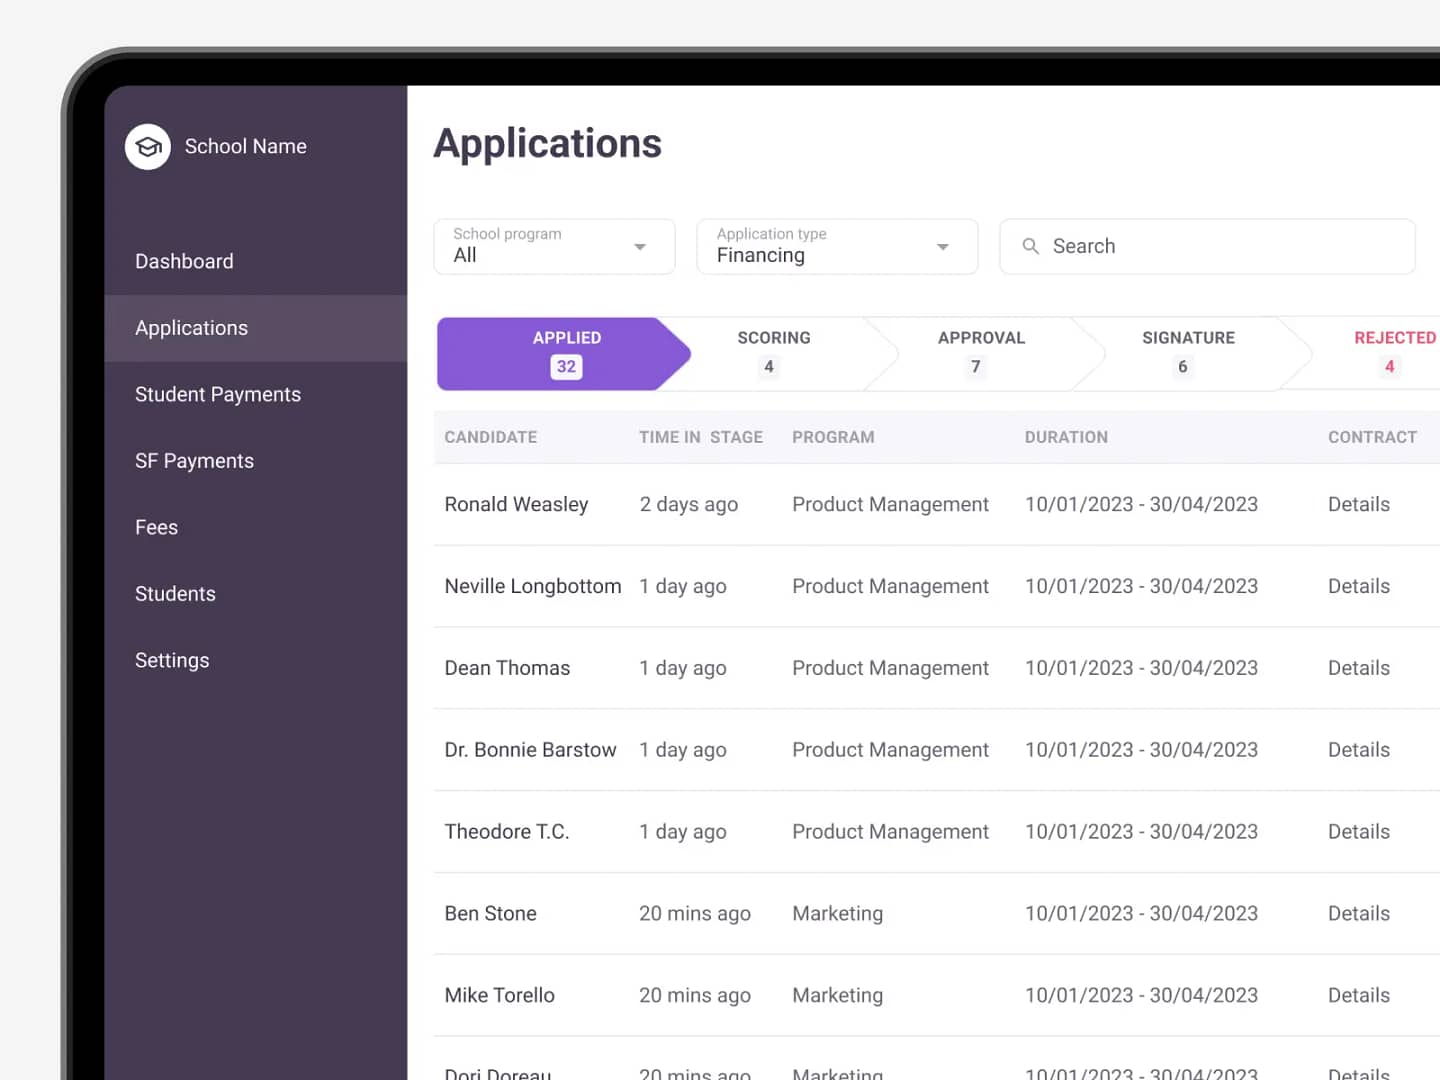
Partner schools were managing applications, payments, and student outcomes across spreadsheets, emails, and manual reports. This was messy, slow, and caused mistakes.

The Challenge

I designed and tested a partner dashboard prototype that centralized these workflows into a single, role-specific tool, providing admissions teams with visibility into applications and finance teams with clarity on repayments and cash flow.

Managing student financing was fragmented and unreliable, creating wasted time and trust issues.

  • Critical data scattered across spreadsheets and emails
  • Staff wasted hours each week on manual tracking
  • Finance teams lacked real-time visibility into cashflow and repayments
  • Limited transparency reduced trust with schools and students

Project Goals

  • Time savings: reduce hours of manual reconciliation each month
  • Trust: real-time transparency to improve school confidence in reporting
  • Scalability: standardize workflows to support more schools and programs
  • Financial clarity: better forecasting and reduce risk for both schools and investors

Design Process

1. Discovery

2 weeks

I ran workshops with stakeholders to define user personas and define better the value proposition. We mapped workflows across admissions, finance, and business development.

Trade-off: Covering all roles at once was too broad, so I focused first on finance workflows, since cashflow forecasting had the highest impact on partner trust.

2. Design

4 weeks

I translated insights into wireframes, and high-fidelity prototypes. Benchmarked dashboards for best practices. The goal was to simplify admissions and finance tasks while ensuring data clarity.

Principles:

  • Glanceable dashboards that surface key metrics first
  • Role-specific clarity for admissions vs. finance users
  • Consistency across modules to reduce training time

3. Testing

2 weeks

I tested the prototype with key stakeholders to validate clarity, trust, and ease of use. Feedback confirmed the dashboard improved data visibility and reduced manual work. Iterated based on input to keep the design focused on what mattered most.

Iteration: Adjusted dashboard layout to reduce clutter and ensure KPIs were always visible at the top.

4. Validation

2 weeks
  • Stakeholders confirmed the prototype reduced manual reporting
  • Finance workflows were clearer and easier to reconcile
  • Prototype showed the dashboard could strengthen school confidence if implemented.

Opportunity: The success of this design led to the dashboard being extended for enterprise clients, showing its value beyond the initial scope.

The Solution

The new dashboard prototype replaced scattered spreadsheets with a single, role-specific tool. It gave schools a clear view of applications, payments, and student outcomes in real time. This transformed a messy, manual process into a scalable workflow that schools could trust.

Key Features:

  • Applications pipeline with clear stages to track student progress
  • Payments tracking in both list and calendar views for flexibility
  • Student detail pages with contracts, payments, and employment status
  • Dashboard overview surfacing key metrics for finance and admissions teams

Visual Showcase

1
Payments Overview Real-time visibility into payments helps finance teams stay on top of cashflow and avoid reconciliation delays
2
Active Users Tracking active students ensures schools can forecast ISA obligations with confidence
3
Applications Pipeline Clear pipeline stages reduce manual tracking and give admissions teams instant visibility on progress
4
Student Payments Automated repayment tracking replaces spreadsheets and flags issues early to protect revenue
5
Filters & Export Custom filters and one-click exports make reporting fast and investor-ready
1
All contract terms in one place, schools can validate agreements without digging through files
2
At-a-glance repayment health. Progress, timelines, and risks shown in one unified view
3
Month-by-month view eliminates spreadsheets, making reconciliation instant and error-free.

User Impact

Applications tracking

Before: spreadsheets and emails
After: centralized pipeline

Payments tracking

Before: manual reconciliation
After: real-time tracking

Student details

Before: Repayments scattered
After: Unified student record

KPIs

Before: no visibility on performance
After: role-specific KPI dashboard

Key Learnings

  • Finance and admissions teams need tailored views to adopt dashboards
  • Simple tables and clear flags worked better than complex reporting
  • Multiple views (list + calendar) improved payment tracking efficiency
  • Consistency across modules built trust and reduced training time